Everything CandleDraw does, in one page.
Everything for drawing Japanese candlestick charts by hand, whatever market they come from. The tools, the studies, the replay and the teaching loop: what each one does, and what it is for. Start anywhere.
Getting a chart on the canvas
Four ways to start, and none of them is a screenshot.
The chart you need to show usually does not exist yet: the textbook example, the setup still forming, the counterfactual. So it gets built rather than found, and there is more than one way in.
Draw it
Drag out a candle, then drag its four handles until the open, high, low and close are exactly the ones you mean.
Generate it
Start from a chart built at a chosen timeframe, with trend and volatility sliders, and edit from there.
Import it
Bring in an OHLC CSV. Times and volumes are kept when the file carries them.
Sketch it
Draw the shape of the move as a zig-zag and convert it into a real candle sequence, with a variation slider running from one clean colour per leg to twice the measured hourly shape.
Rough sketch into candles
Sketch the move. Get real candles.
Draw the shape of the move you are explaining as a single stroke, and convert it into a candle sequence that actually reads as one: pullbacks inside the runs, wicks where price turned, and colour changing where the move did. A slider decides how many candles the stroke becomes, and a second one runs from one clean colour per leg up to twice the shape a real hour has, so the same sketch can be a textbook impulse or a grind, without redrawing it.
Annotating the argument
Mark the level, draw the path, attach the reasoning.
Every mark stays editable, so the argument can change with the idea. Select several at once to move them together, and give a mark a timeframe range so a note about the hourly chart does not clutter the daily one.
Assign the four tools you actually reach for to the quick tool menu and middle-click the canvas to get them where the pointer already is. The rail stays available, but the tools you switch between all day stop being a trip across the screen.
Lines
- Line
- Horizontal line
- Vertical line
- + 4 more
Shapes and zones
- Rectangle
- Ellipse
- Triangle
- + 3 more
Levels and measurement
- Fibonacci
- Measure range
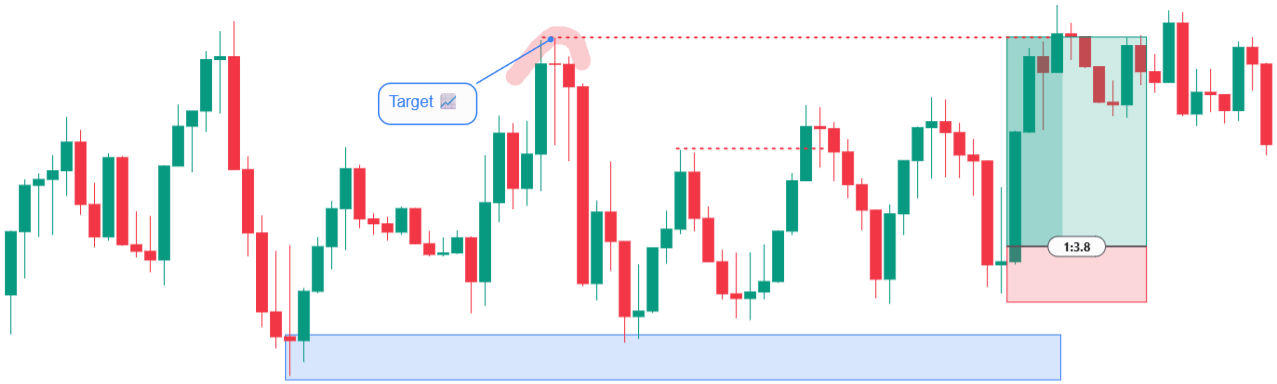
- Risk/Reward
Notes
- Text
- Callout
- Arrow
Patterns and structure
- ABCD pattern
- XABCD pattern
- Elliott impulse
- + 8 more
Studies and analysis
46 entries, in one flyout, in six categories.
Grouped by what a study tells you rather than by where it lands, because that is the question somebody opening the list is asking. An overlay and a pane sit side by side under Momentum.
Trend
9Moving Average · VWMA · Ichimoku Cloud · Higher timeframe candles · SuperTrend · Parabolic SAR · ADX / DMI · Alligator · Gator Oscillator
Bands and channels
5Bollinger Bands · Bollinger %B · Keltner Channels · Donchian Channels · Envelopes
Momentum
15Relative Vigor Index · RSI · Stochastic · Stochastic RSI · CCI · Williams %R · Rate of Change · Momentum · TRIX · DeMarker · Bulls Power · Bears Power · Accelerator Oscillator · Awesome Oscillator · MACD
Volatility
3ATR · Standard Deviation · Bollinger Bandwidth
Volume
11Force Index · Chaikin Oscillator · Volume · On Balance Volume · Accumulation / Distribution · Money Flow Index · Chaikin Money Flow · Rolling VWAP · Anchored VWAP · Volume Profile · Footprint
Levels and patterns
3Pivot Points · Pivot zones · Candle pattern detection
What the studies do that a list of names cannot show
A study can read another study
Point a moving average, RSI, MACD or Bollinger %B at another study instead of at price. A broken reference reads as absent and the study goes back to price.
Two studies can share one pane
Put comparable readings in one box, against one axis, at a height you set.
Divergence marking
Marked on the oscillator, read at the same candles on price, and only between consecutive pivots.
Pattern detection, read-only
Nine candle patterns plus fractals, marked where they were found. Nothing is added to your drawing.
The three analysis drawings
Volume Profile
Volume by price over a range you pick, with the point of control and value area.
Anchored VWAP
A volume-weighted average from a candle you anchor it to.
Footprint
A whole layer read as intrabar activity at each price level, buying against selling, on one shared price grid.
Where a chart carries no imported volume, the volume tools estimate it from the candles, ask before drawing, and say so on the chart. Nothing pretends to be traded data.
Replay
Watch the chart print.
Play a drawn or imported chart back candle by candle from a start point you place. Set the speed, step through it, and switch timeframe while it runs.
A forming candle is built out of the finer candles inside it, so the open never moves, the range only widens, and the last frame is exactly the candle you drew, by construction rather than by correcting the final frame. Drill into a bar and you see the same breakdown the replay used.
Real minutes put a bar's extremes about 42% of the way through it rather than at the midpoint, and the replay does the same. A bar still setting new extremes on its final tick is the clearest tell that a breakdown is synthetic.
Finishing and shipping
The chart leaves as a picture, or as data.
Export the whole canvas or a region you select, branded or plain. The shortest path in the product is the one from a blank canvas to a clean image, and everything here is on it.
Saved projects
- Pro
- Up to 100, in up to 15 categories
- Educator
- Up to 300, in up to 30 categories
Your work syncs to your account rather than to one browser.
PNG export
The canvas as a crisp image, without editor chrome.
Transparent PNG
The same image with no background, for slides and posts that carry their own.
Copy to clipboard
Straight into the message you were writing.
CSV export
The candles as data, at the prices they were drawn at.
JSON export
The whole document, to keep or to move.
Text watermark
Your name across the exported image.
Logo watermark
Your mark instead, placed where it does not cover the chart.
Accent colour
Chart branding in your own colour.
Title and subtitle
A titled figure, ready to publish.
Chart customization mode
Styles persist across canvases rather than resetting every time you start one.
Teaching
The canvas doubles as the classroom.
Set the work on a chart, review what comes back on the same chart, for a class you teach or a desk you train. The student never leaves the drawing space they learned in.
Bring students in
Share your affiliate link, or add somebody who already has an account using the student code from their profile. Everyone who joins through you appears in the hub.
Group them into cohorts
A cohort is a class: the group you hand the same work to. One per intake or per course, and a student can be in several. A student in no cohort receives nothing.
Build the material
Set a chart up on the canvas and turn it into an assignment: the student opens your chart and works on top of it. Sections are the shape of the course, nested where a topic needs it. Nothing here has reached anybody yet.
Put it together and release it
Add assignments to a section to fix the order they are worked through, then release that section to a cohort. All at once, or sequentially so the next one unlocks as the previous is approved, per student or for the cohort together.
Mark what comes back
Open a submission to see the student’s chart, leave feedback, and approve or return it. On a sequential release, approving is what unlocks the next assignment.
What the canvas adds
Assignments hold back what comes next
Lock the reference candles, and place a reveal boundary so the candles beyond it stay hidden until the student submits.
Submissions come back on the same canvas
Marked where the work is, with feedback attached. Return one for revision and it reopens editable; approved work reopens read-only, with the hidden candles revealed.
Take your own assignment first
A self-test before you set it, resubmittable as often as you like.
Per-assignment branding
Stamped onto the assignment when you publish it, so homework already set does not change look mid-term.
Students work on Free
Joining a cohort and handing work back costs a student nothing. The teaching plan is the educator’s, not the class’s.
The affiliate program
Join the affiliate program
Accept the agreement in the hub and take your personal link. Students who sign up through it are yours from then on.
Earn from students who subscribe
A student who joins on your link and later pays for a plan earns you a share of what they pay, for as long as they keep paying.
Earnings and payouts, reported plainly
What has accrued, what is available, and every payout you have requested. A statement, not a leaderboard. No counters, no ranks.
Draw the first candle.
Start on Free after sign-in. No card, and no plan to choose first.